Home Affordability Still A Reality!
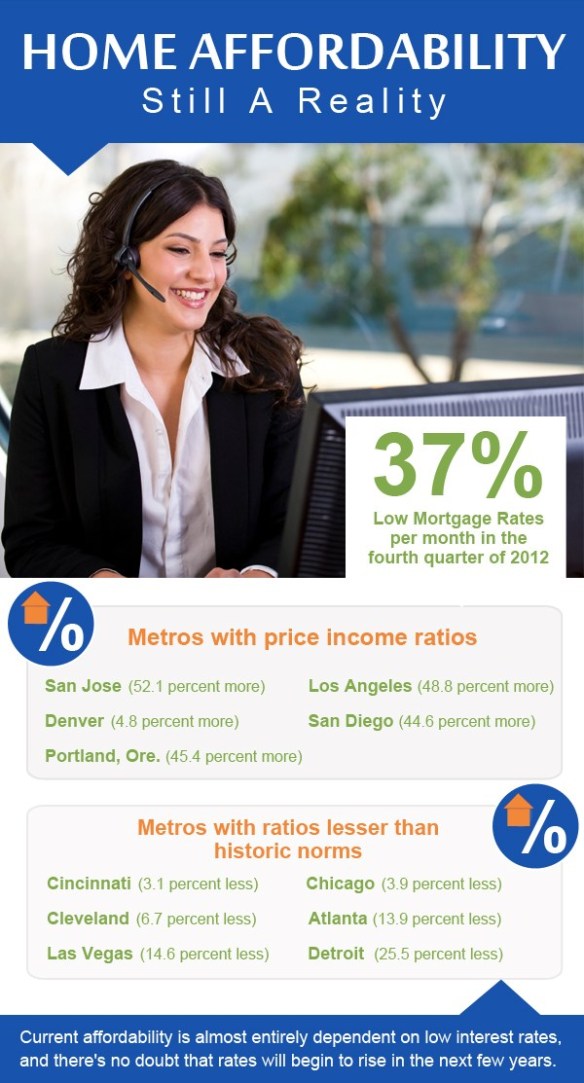
Last year, the American housing market saw historically low mortgage rates and it was seen that homeowners paid approximately 37% less per month in the fourth quarter of 2012, even though homes cost about 14.5% more. Zillow conducted a study of current and historic median home values and median incomes, obtained from the U.S. Census and the Bureau of Labor Statistics, for more than 240 metro areas and the nation as a whole. The results of this study were used to calculate an affordability index (measuring the portion of monthly income homeowners spend on mortgage payments) and a price-to-income ratio, analyzing the cost of homes when compared to annual incomes.
Let’s take a look at some of the numbers from this study.
1. In the pre-bubble period from 1985 through 1999, rates for a 30-year fixed mortgage ranged between 6 and 13% – Americans spent, on average, 19.9% of their median monthly incomes on mortgage payments for a typical, median-priced home. At the end of the fourth quarter of 2012, mortgage rates were in the 3 to 4% range and homeowners were paying 12.6% of their monthly income on mortgage payments.
2. Homes have become more expensive in many areas as wages have dropped or stagnated. In the pre-bubble period, U.S. homebuyers spent, on average, 2.6 times their median annual income on the purchase price of a typical home. By the end of 2012, buyers across the nation were spending three times their annual incomes. This means that people were buying homes that were 14.5% more expensive when compared to their incomes.
3. Homeowners in 24 of the 30 largest metros covered by Zillow were paying a lot more for homes in the fourth quarter of 2012, when compared to the median income in their region.
4. Metros with the largest difference between their pre-bubble and fourth quarter 2012 price-income ratios:
a. San Jose (52.1 percent more)
b. Los Angeles (48.8 percent more)
c. Portland, Ore., (45.4 percent more)
d. San Diego (44.6 percent more)
e. Denver (40.8 percent more).
5. Metros that showed price-income ratios lesser than historic norms:
a. Cincinnati (3.1 percent less)
b. Chicago (3.9 percent less)
c. Cleveland (6.7 percent less)
d. Atlanta (13.9 percent less)
e. Las Vegas (14.6 percent less)
f. Detroit (25.5 percent less)
All good things come to an end, so will the high levels of home affordability. Stan Humphries, Chief Economist at Zillow says, “Current affordability is almost entirely dependent on low interest rates, and there’s no doubt that rates will begin to rise in the next few years. This will have an undeniable effect on demand for housing, as home buyers will have to spend more of their incomes to buy a home.” We would recommend that those of you who are planning to buy a home should make a decision soon, before all good deals are gone. For more information regarding mortgage related tax forms, please contact 4506-Transcripts.